
Here at ACEEE we are big fans of combined heat and power (CHP). It’s energy efficient, it helps with resiliency, and it could be a key strategy for complying with carbon pollution reduction requirements. Each year, as part of the State Energy Efficiency Scorecard, we rank states on policies that encourage deployment of CHP. With each iteration, we review our scoring methodology and collect information on the environment facing CHP developers. As with all of our metrics, scoring of CHP in the State Scorecard focuses on states’ policies, which is only one element that influences the favorability of a state to CHP development.
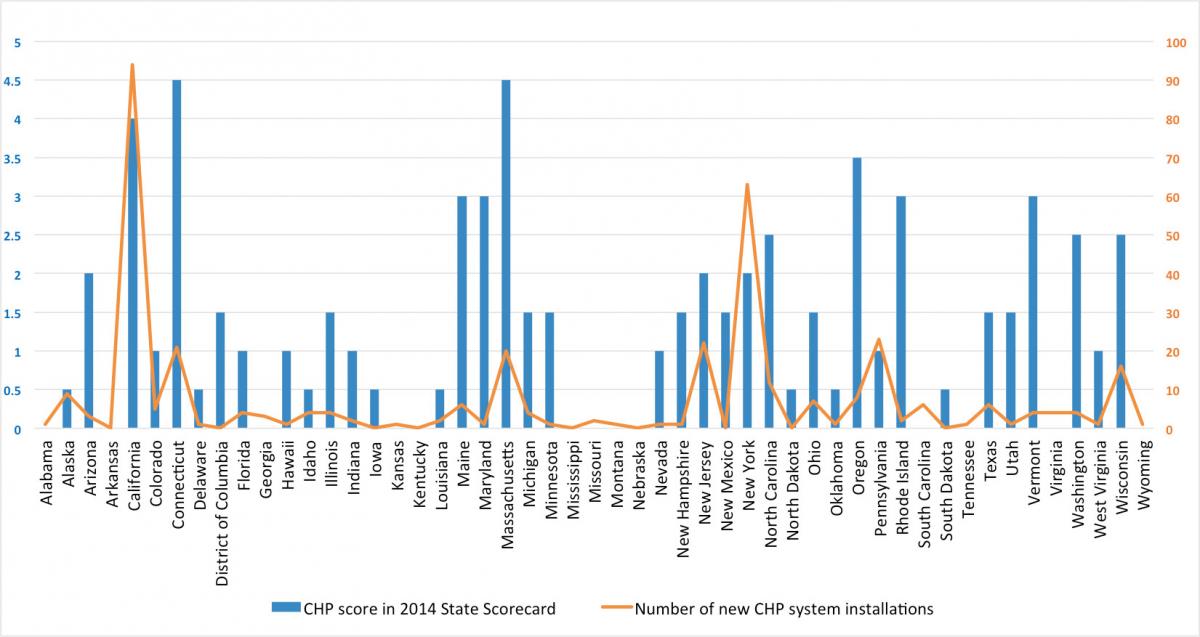
In a recent blog post, we looked for a correlation between 2014 CHP State Scorecard scores and actual new CHP installations as a simple way to examine the overall relationship between policy and deployment. While the results indicate a moderate correlation between scores and deployment, some inconsistencies exist in states where CHP installations have stayed low despite numerous supportive policies being on the books for many years.
We know that state policies are only a piece of the puzzle when it comes to CHP. A variety of economic factors influence deployment—most importantly, the financial attractiveness of individual CHP investments to host facilities. One of the biggest factors influencing economic attractiveness is the retail price of energy. In states with very low electricity prices, it is often more economical to buy electricity from the grid than to generate electricity onsite with CHP. By contrast, higher electricity prices can make the case for onsite generation with CHP more favorable. Similarly, lower and more stable natural gas prices offer cheaper fuel costs that can improve the economics for CHP.
To get a rough look at the degree to which prices influence the CHP market in a given state, we developed a state-by-state CHP favorability index using information we collected for our 2014 State Scorecard project and for another recent analysis. In that analysis, we estimated the CHP potential achievable in each state using publicly available data from ICF International. Then, we used sector- and state-specific electricity and gas prices forecasted by EIA from 2016 to 2030 and operating characteristics of the potential CHP in each state, which yielded an adjusted CHP potential that includes only those projects that remain cost-effective under future forecasts. The ratio of our original “ACEEE Estimated Achievable CHP potential” to the estimated potential that was adjusted for cost-effectiveness is a market favorability index, which tells us how favorable electricity and gas prices are to the future business case for CHP in a given state.
Recognizing that better policies yield overall improvements in project economics, such as when improved interconnection standards yield reduced costs, we also developed a policy metric using 2014 State Scorecard scores as a proxy for such regulatory factors. This policy favorability index tells us how favorable the existing policy environment is for CHP in a given state. The figure below shows the market favorability index side-by-side with the policy favorability index for twelve Midwestern states.
Midwest CHP favorability index

Seven of the Midwest states show an extremely high level of market favorability for CHP deployment, coupled with only moderate to low levels of policy activity. Future state policy and regulatory action is likely to have the greatest impact in states such as Wisconsin, Illinois, and Ohio, where the market favorability index is high and the groundwork for policy measures are in place. Michigan is an example of a state where, due to unfavorable economic conditions, CHP installations are unlikely to increase despite having supportive policies in place. However, in a state such as Nebraska, which has favorable economics, policies like those in Michigan or Wisconsin could result in greater deployment.
Advocates often wonder why the volume of investments in CHP falls short of their estimated potential. The favorability index may answer this by giving us a glimpse of the impact of market and policy favorability on the potential capacity for CHP installations in a state. In the figure below, we show the original ACEEE-estimated achievable CHP potential by 2030 for each state in yellow. In blue, we apply the market favorability index to existing potential to demonstrate how market conditions can prevent some potential CHP installations from occuring. Finally, in gray, we apply both the policy and market favorability index to existing potential to demonstrate how market conditions and regulatory barriers lower potential CHP penetration.
Impact of market and policy favorability on CHP potential

In the figure, accounting for market conditions (in blue) actually does little to diminish the CHP potential in the majority of Midwest states. This suggests that even when the economics are there, it is a lack of supportive state policy (in gray) that is largely responsible for affecting investments in new CHP projects.
We think the CHP favorability index concept that we’ve presented here can be a useful tool for CHP developers, policymakers, and advocates to use in their discussions. It highlights states where policy changes can make a difference, and where they probably will not. We would be remiss if we did not mention, as a caveat, that both indices exclude certain economic considerations beyond energy prices that can also impact market favorability for CHP. However, the approach represents a start at visualizing the interplay between policies and economic factors influencing CHP deployment and gives us a new way of discussing this subject. We look forward to receiving comments on the usefulness of this tool.
This Article Was About
CHPAuthors


