In 1973, the Arab members of the Organization of Petroleum Exporting Countries (OPEC) imposed an oil embargo that increased energy prices, spurring efforts to conserve energy and improve energy efficiency in the US and worldwide. In 1980, energy efficiency researchers formed the American Council for an Energy-Efficient Economy. As we turn 35 years old this year, we thought it would be useful to look at energy efficiency progress over the past 35 years, and to also look at possible and recommended pathways for the next 35 years. Today we are releasing the results of this work in a report entitled Energy Efficiency in the United States: 35 Years and Counting.
The Past 35 Years
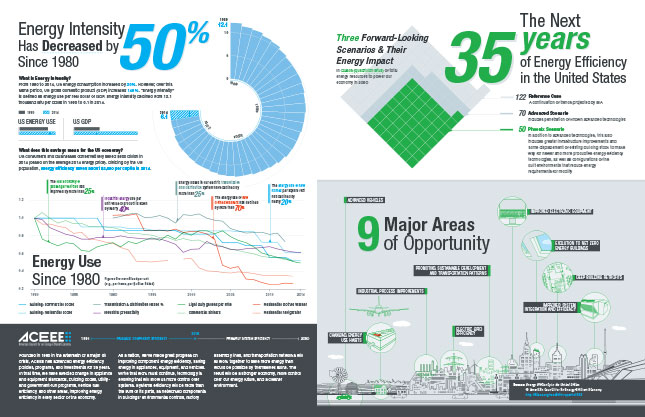
From 1980 to 2014, US energy use increased by 26%; however, over this same period, gross domestic product (GDP) increased 149%. “Energy intensity,” defined as energy use per real dollar of GDP, is a common approach for combining these two variables. US energy intensity has declined from 12.1 thousand Btu per dollar in 1980, to 6.1 in 2014, a 50% improvement. While part of that improvement can be attributed to structural changes in the economy, we conservatively estimate that about 60% of the improvement in energy intensity is due to efficiency improvements, saving consumers and businesses about $800 billion in 2014. Dividing by the US population, energy efficiency saved about $2500 per capita in 2014. These efficiency investments and savings also generated jobs and drove modest growth in the overall size of the economy (check out our fact sheet to learn how energy efficiency creates jobs).
Energy efficiency savings over the past 35 years have also improved our nation’s energy security and our environment. For example, fuel economy improvements and standards have driven down oil use in the transportation sector. Looking specifically at petroleum, imports were 33% of US crude oil use in 1983 (the recent low point), increasing to 67% in 2006 before declining to 44% in 2014. Reductions in oil, natural gas, and electricity consumption also mean reduced emissions from the combustion of fuels, including reduced emissions of sulfur dioxide and nitrogen oxides (contributors to acid rain and smog), mercury and other toxic metals (contributors to health problems), and carbon dioxide (the largest contributor to greenhouse gas). In 2014, US carbon dioxide emissions totaled 5,404 million metric tons (MMT), 10% below 2005 levels.
These overall improvements are a result of many small and large improvements throughout our economy, including improvements to equipment, new and existing buildings, industrial processes, vehicles, planes, and the electric grid. Some of these improvements are illustrated in the figure below.
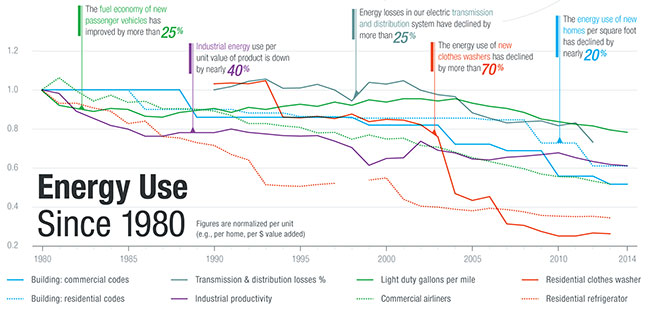
Many factors have driven these efficiency improvements, including market forces, policy impacts, and the interplay between the two. To take one example, appliances have improved dramatically due to the combined impacts of federal and state appliance efficiency standards, the voluntary ENERGY STAR® labeling program that recognizes products of above-average efficiency, utility energy efficiency programs, and tax incentives that have encouraged manufacturers to develop more efficient products. On the other hand, energy prices have not been a major driver, since energy prices today are either similar to, or less than, 1980 prices, after the effect of inflation is removed.
The Next 35 Years
While much progress has been made, there are large and cost-effective energy efficiency opportunities that collectively can reduce 2050 energy use by 40-60% relative to current forecasts. Opportunities include:
- Improved systems integration, including use of sensors, controls, “big data” and computer chips to monitor and control energy use in real time, a set of opportunities that has been labeled “intelligent efficiency;”
- Improvements to the many types of equipment, such as computers, televisions, and elevators that collectively account for growing miscellaneous energy loads;
- Evolution of new building design to zero net energy and ultra-low energy buildings;
- Industrial process improvements;
- Increased use of advanced vehicles including electric, hybrid, and self-driving vehicles;
- Taking building energy retrofits to a much higher level, including both more retrofits and deeper retrofits (greater savings per building);
- Improving the efficiency of the electric grid through expanding use of combined heat and power systems, improving power plant efficiency, reducing transmission and distribution losses, expanding use of other distributed generation resources, and improving grid control and integration;
- Promoting sustainable development and transportation patterns; and
- Working with consumers and businesses to change wasteful energy-using behaviors.
If we aggressively pursue these efficiency opportunities, we can roughly double the rate of efficiency improvement in the next 35 years relative to the past 35 years, and reduce 2050 energy use to half of current forecasts. To do this we need to take our efforts to promote energy efficiency to a new level, which means both doing it better and doing it smarter. Our efforts should:
- Harness and transform markets
- Make efficiency a key strategy for the utility of the future
- Expand federal, state, and local policy efforts
The new report discusses these strategies in more detail, but take a look at the infographic below to see a snapshot of the past and future 35 years of energy efficiency. Our nation’s history of success with energy efficiency shows us what efficiency can do, and provides important lessons that will help guide us to leave a positive economic and environmental legacy for future generations.
This Article Was About
Commercial Buildings Building Policies and Codes Mobility ChoicesAuthors