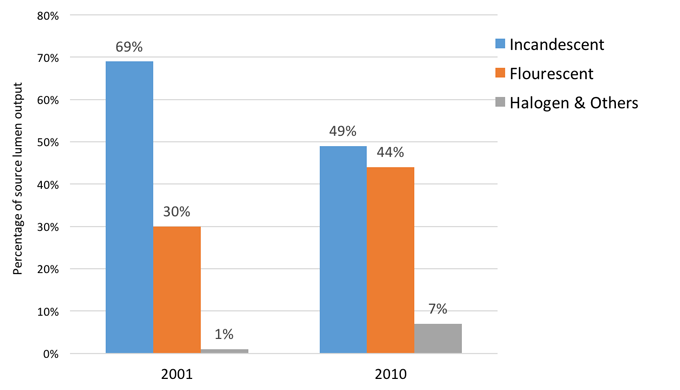
Several recent sets of data show large improvements in lighting energy efficiency in recent years. First, DOE has commissioned two US Lighting Market Characterization studies – one with data on installed lighting in 2001, the other with data on installed lighting in 2012. Figure 1 compares these two studies for the residential sector, showing how conventional incandescent lamps declined from 69% of total annual light provided in 2001 to 49% in 2010. In 2010, fluorescent lamps (tubes and compact fluorescent lamps) plus halogen and other lamps accounted for more than half of the lighting provided to US homes.
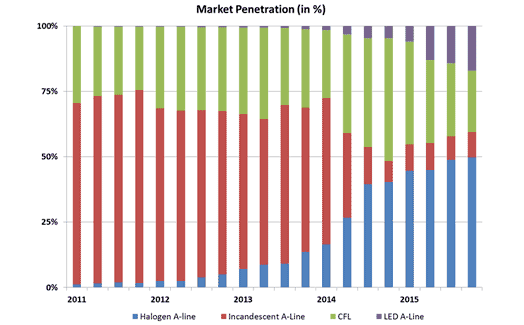
The residential lighting mix continues to change rapidly. Figure 2 shows the distribution of A-line screw-in lamp sales by year using data compiled by the National Electrical Manufacturers Association (A-line means the standard pear-shaped light bulb). Standard incandescent lamps declined from nearly 75% of lamp sales in 2011 to only 8% of lamp sales in the fourth quarter of 2015 in which half of sales were halogen lamps, 23% were compact fluorescent lamps, and 17% were LEDs (light-emitting diode lamps).
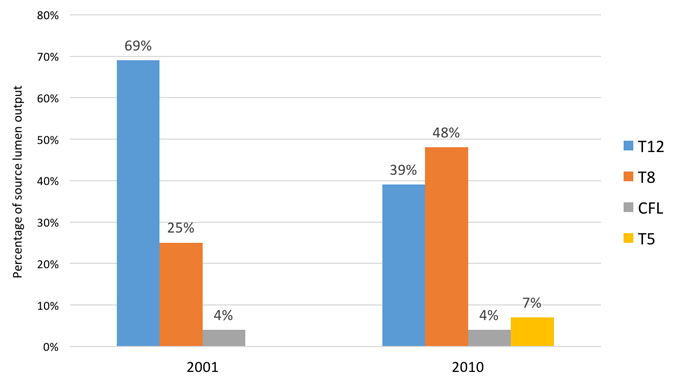
Comparable trends can be seen in data for the commercial sector. Figure 3 summarizes data for lighting in the commercial sector in 2001 and 2010. “T12” lamps (1.5 inches in diameter and typically using 34 or 40 watts of power) declined from 69% to 49% of light provided, while “T8” and “T5” lamps (1 and 5/8 inch diameters and typically using 26-32 watts of power) increased from 25% to 55% of lighting provided.
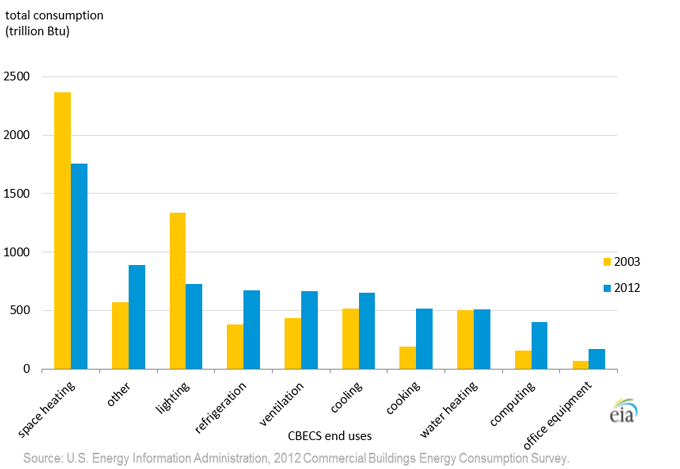
The large energy savings that result are shown by recently released data from the 2012 Energy Information Administration (EIA) Commercial Buildings Energy Consumption Survey (CBECS). EIA found that commercial building lighting energy use declined by 46% from 2003 to 2012, as shown in Figure 4, even though EIA also found that commercial building floor area increased by 22% over this period.
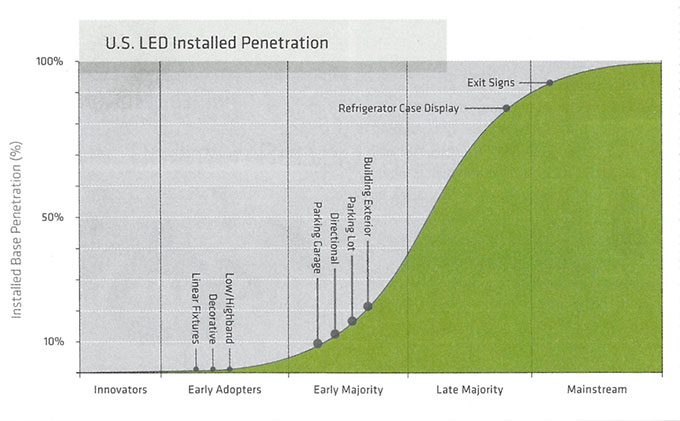
These four figures show recent trends, but lighting continues to rapidly evolve. Figure 5 looks at the saturation of LED lighting in different applications on a market diffusion curve. Some applications are now largely LED, such as exit signs and refrigerator case lighting. In all likelihood, even applications with low LED penetration currently, such as linear fixtures and decorative lighting will move steadily up the market diffusion curve in coming years.
Data Points is a blog series focusing on the graphs and other images that tell the energy efficiency story.
Authors