The Obama administration’s energy efficiency efforts are saving billions of dollars each year and could save trillions by 2040. The projected savings by then are far more than what consumers now spend on phones and the Internet, combined.
Even as President Barack Obama has made energy efficiency a top priority, it’s remarkable that federal agencies have achieved these savings over the last eight years by implementing bipartisan laws passed before he entered the Oval Office. Our new analysis reveals how much the United States has saved and still can in the future. If President-elect Donald Trump does not want to shut off a huge moneymaker for the US economy, he should continue these policies.
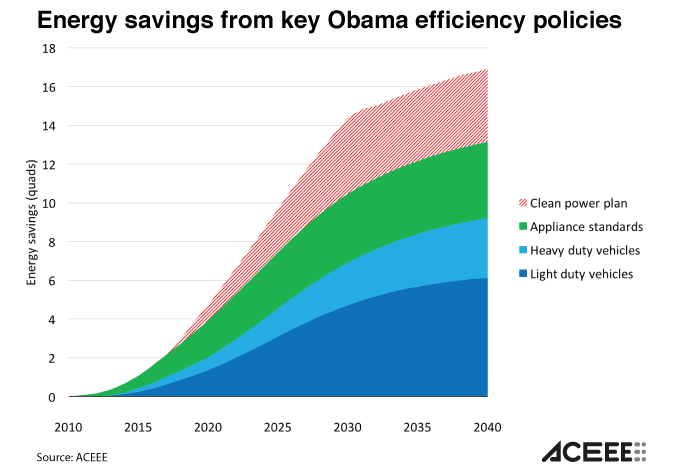
As shown in the graph below, a few recent energy efficiency policies are helping Americans save about 2 quadrillion Btu (quads) of energy this year, or about 2% of all US energy use. These energy savings are worth about $30 billion this year. But that is just a small advance.
The real benefits should arrive long after Obama, and even after Trump, leaves the Oval Office. In the years to come, as people buy new cars and equipment and we hope as states implement more programs, the savings from policies already put in place will blossom. By 2030, we project these actions will save 10-14 quads of energy a year (10-14% of all energy use), worth $250-290 billion a year. By 2040, the savings continue to increase to 13-17 quads and $370-410 billion a year. They could reduce carbon dioxide emissions by as much as a billion tons a year. We estimate the present value of the energy savings through 2040 at $2.5-2.9 trillion. (This does not count the investment needed, but that will be much smaller).
The Three Policies
We estimated savings only for the three most significant energy efficiency policies set by the administration.
First, Congress directed the Department of Transportation (DOT) in 2007 to update fuel economy standards for cars and light trucks for the first time in decades, and to set new standards for heavier trucks and buses. The administration combined that direction with standards on tailpipe carbon dioxide emissions by the Environmental[WK2] Protection Agency (EPA) and the state of California to achieve major oil savings with stunning consumer benefits—mostly with agreement from manufacturers. For trucks and buses, DOT and EPA recently set a second round of standards through 2027. However, the car and light truck standards for 2022-2025 are scheduled for review, and a large chunk of the savings shown in the graph could disappear if the standards are weakened.
Second, after decades of delays, the Department of Energy has actually followed the law in setting and updating appliance standards. It worked through a backlog under multiple laws and carried out a requirement for periodic review of standards under the Energy Independence and Security Act of 2007. However, some of the standards were specified directly in the laws, and several of the most important were based on consensus agreements. A few still remain to be set. Again, it is important that the recent standards, and the billions of dollars in savings they are bringing to American consumers and businesses, not be reversed. In fact, the standards are to be updated over the next eight years, and in a recent paper, we found that the next round of standards could save about as much energy as the last one.
Third, along with regulating vehicle emissions, the EPA has begun to regulate carbon dioxide from other sources under the Clean Air Act, following a 2007 Supreme Court ruling. Most notably, in 2015, the, EPA issued regulations for existing power plants in [LU3] the Clean Power Plan. The graph shows potential savings from energy efficiency spurred by the plan (it does not address renewables or fuel switching). The savings are striped, because they are triply uncertain: the plan is under review by the courts and could be changed; Trump has vowed to kill it; and under the current plan, the states would have a lot of flexibility in how to meet the standard, including whether to use efficiency or different sources to cut emissions. But whether or not the plan survives, the striped area [WK4] shows the large savings states could achieve if more of them implement energy efficiency programs, which are usually the cheapest option for meeting electricity needs with or without the Clean Power Plan.
Of course, agencies have been implementing many other energy-efficiency policies and programs as well (though in some cases very slowly): Energy Star, support for building energy codes, low-interest loans through rural electric coops, guidelines for local government “PACE” financing, new programs like Better Buildings, research and development of new technologies, grants to state and local governments under the Recovery Act, retrofits of federal buildings, and more. Together these programs will save consumers money, boost the economy, create jobs, strengthen the energy system, clean the air, and improve public health for decades to come.
One of the quotes on the rug Obama had designed for the Oval Office reads: “The arc of the moral universe is long, but it bends towards justice.” The arc of energy policy can be long too, but under Obama it has bent strongly towards energy efficiency. And while Trump has signaled skepticism towards climate change, he has often spoken about the value of a good deal. We hope the new administration will recognize the tremendous savings these policies have helped our nation’s consumers and businesses achieve, and it will continue to make saving energy and money a national priority.
Methodological Notes
The savings analyses follow similar methodologies to our 2014 white paper, Government Works, and are explained in more detail there, but all are updated here. I thank Joanna Mauer, Therese Langer, Siddiq Khan, and Eric Junga for their assistance in the calculations.
Estimates are for the impacts of the policies compared to a no-action baseline. We did not estimate measure costs this time (dollar figures only reflect energy savings). We did not include any interactive effects, though in some scenarios appliance standards savings could count toward the Clean Power Plan. Because the Plan is one of the policies, fuel prices and carbon dioxide intensities are taken from the Energy Information Administration’s 2016 Annual Energy Outlook No CPP case (unadjusted for the additional policies). Dollar amounts are in 2015 dollars. The present value uses a real 5% discount rate.
Fuel economy standards are estimated compared to a base case of 2010 fuel economies using Argonne National Laboratory’s Vision 2015 model. Appliance standards are estimated compared to previous standards, with fixed appliance efficiencies and sales (except the light bulb standard, which has a dynamic model as explained in Bending the Curve). For potential savings under the Clean Power Plan, we assumed states on average would achieve 1.25% new electricity savings each year through 2030 (and would also make up earlier savings that decay through 2040). But the reported savings are compared to 0.7% new savings each year that would still have occurred in the base case. The method (but not the numbers) is taken from the calculation for an energy efficiency resource standard in a report from last year.
The comparison of how much consumers spend on phones and phone service ($183 billion a year) and Internet ($104 billion) is from the Bureau of Economic Analysis.