This is the first post in a three-part series on understanding and increasing investments in energy efficiency by businesses and individuals. The second post discusses the motivations for investment, and the third discusses approaches that could increase investment in the future.
Energy efficiency investments occur in virtually every sector of the economy. When combined, their total number is substantial — estimates range from about $60 to $115 billion a year in the United States. In this post, we look at some recent estimates of energy efficiency spending, updating and expanding information we compiled earlier this year so that we may better understand the magnitude of these investments and where they occur. These findings provide a foundation for two subsequent posts we will publish in the next month on “Who invests in energy efficiency and why?” and “How can we increase energy efficiency investments?”
IEA World Energy Investment Report
Last week, the International Energy Agency (IEA) released its World Energy Investment report, covering 2016 global energy investments. IEA estimates that $231 billion was invested in energy efficiency products and services worldwide, a 9% increase from its 2015 estimate. For the first time, the agency provides an estimate of efficiency spending in just the United States: $41 billion. IEA does not provide a sector breakout for the United States, but worldwide, it estimates about 58% of these investments is in buildings, about 26% is in transportation, and 16% is in industry. While IEA includes the full cost of building envelope retrofits in its estimates, it includes only the incremental costs for high-efficiency equipment and industrial processes. For example, if a high-efficiency air conditioner costs 10% more than a conventional air conditioner, IEA counts only 10% of the total cost.
AEE Market Report
Advanced Energy Economy (AEE) publishes an annual Market Report that estimates annual revenues in “advanced energy” in the United States, including energy efficiency, advanced vehicles, renewable energy, biofuels, the electricity grid, and natural gas fueling stations. Investments in building and industrial energy efficiency and plug-in and hybrid vehicles came to $94 billion in 2016, an 8% increase relative to its 2015 report. AEE includes only specific market segments for where it has data. For example, for industrial efficiency, it includes only industrial energy management and combined heat and power systems, so some forms of efficiency investment are left out. On the other hand, for efficient equipment and vehicles, AEE includes the full cost of these products and not just the incremental cost relative to the standard products. AEE provides a detailed breakdown of these investments, which we used to prepare the pie chart below. Buildings constitute 73% of the investments, transportation 18%, and industry is only 9% due to the limited categories it included.
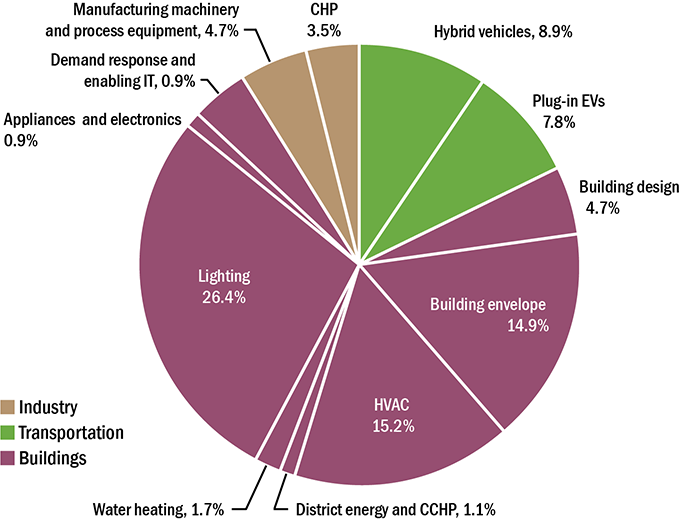
Source: ACEEE analysis of data in AEE 2017 Market Report.
Additional Efficiency Investments
In general, both the IEA and AEE figures include elective purchases and not investments needed to meet minimum efficiency standards and codes. Significant amounts of energy are saved by equipment efficiency standards, vehicle efficiency standards, and building codes. While IEA does include spending to implement 2012 and 2015 codes (relative to 2009 codes), according to our 2016 State Scorecard, 90% of state codes are from 2009 or earlier. To address this gap, we estimated the incremental spending on efficient equipment, vehicles, and buildings due to these policy measures, finding they total roughly $20 billion per year (details can be found here). Therefore, we estimate that the total amount of efficiency investments in the United States are on the order of $60-115 billion per year, adding $20 billion to the IEA and AEE estimates.
Other Studies
Several other studies have estimated US efficiency investments to be of a similar magnitude, including Booz Allen Hamilton ($53 billion in 2014 for green buildings) and Laitner ($72-101 billion in 2010), reinforcing the idea that $60-115 billion is a reasonable range. Still, this range is broad, and the differences among the various studies are many. Further research to refine estimates and narrow the range would be valuable.
What is driving these investments?
What is driving this $60-115 billion of efficiency investments? While some of this spending comes from decisions by businesses and households to invest in efficiency without an obvious policy influence, policy is a big driver. We estimate that building codes and appliance and vehicle standards are responsible for roughly $20 billion worth. Other programs and policies also drive substantial investment, such as utility energy programs ($7.7 billion in 2015, which leverages additional investments by customers), ENERGY STAR® and Energy Saving Performance Contracts (ESPCs) in public facilities. There is also so-called “spillover” when consumers make investments due to the indirect influence of programs and policies. Examples include purchases that occur when stores stock efficient products more widely due to programs or when architects and engineers specify efficient designs more readily for their clients. Additional information on spillover can be found here. Spillover can even be on an international scale. For example, policies in countries such as Germany and Japan influence products and practices in international markets. This said, a significant portion of the spending encouraged by policy also depends on decisions by businesses and households. We will focus on what influences business and household investment decision making in the next blog post in this series.
This Article Was About
Financing Federal FundingAuthors